
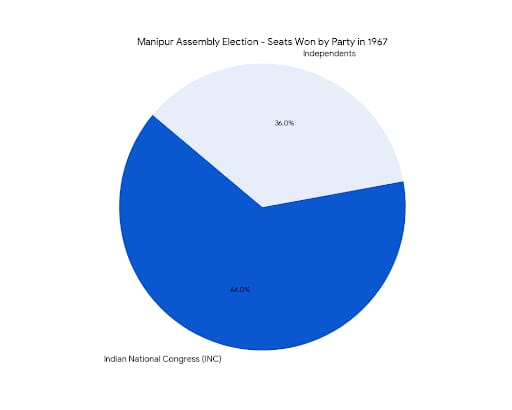
| 1967 Manipur Legislative Assembly Election Results | |||
|---|---|---|---|
| Sr. No. | Short Name | Full Name | Seats |
| 1 | INC | Indian National Congress | 16 |
| 2 | SSP | Samyukta Socialist Party | 4 |
| 3 | Independents & Others | Independents & Others | 10 |
| Total | 30 | ||
The 1967 Manipur election was foundational—ushering in representative governance with the INC at the helm, while also spotlighting the influence of independent candidates and early signs of political volatility in the state’s nascent democracy.
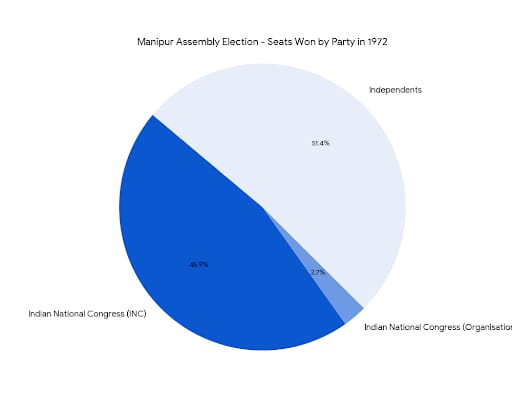
| 1972 Manipur Legislative Assembly Election Results | |||
|---|---|---|---|
| Sr. No. | Short Name | Full Name | Seats |
| 1 | INC | Indian National Congress | 17 |
| 2 | MPP | Manipur Peoples Party | 15 |
| 3 | CPI | Communist Party Of India | 5 |
| 4 | Independents & Others | Independents & Others | 23 |
| Total | 60 | ||
The 1972 Manipur election marked a pivotal moment—ushering in democratic governance under statehood. While the INC emerged as the single largest party, it was the MPP that successfully formed the government in alliance with supporting MLAs. Strong independent and smaller party showings emphasized Manipur’s nuanced and localized electoral landscape.
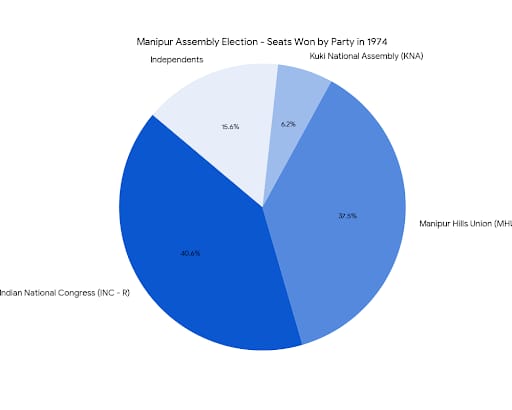
| 1974 Manipur Legislative Assembly Election Results | |||
|---|---|---|---|
| Sr. No. | Short Name | Full Name | Seats |
| 1 | MPP | Manipur Peoples Party | 20 |
| 2 | INC-R | Indian National Congress | 13 |
| 3 | MHU | Manipur Hills Union | 12 |
| 4 | Independents & Others | Independents & Others | 15 |
| Total | 60 | ||
The 1974 assembly election in Manipur was a turning point:
The MPP, though not the most voted, emerged as the largest party and formed the government.
The INC won more votes but fewer seats, highlighting the complexities of vote-to-seat conversion.
Regional parties like MHU and KNA gained ground, while independents’ representation diminished.
Voter enthusiasm and engagement were notably strong.
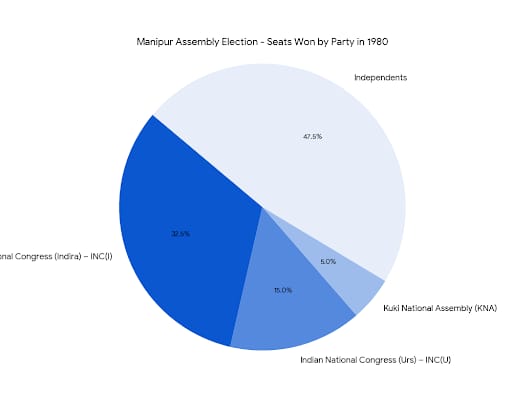
| 1980 Manipur Legislative Assembly Election Results | |||
|---|---|---|---|
| Sr. No. | Short Name | Full Name | Seats |
| 1 | INC-I | Indian National Congress (Indira) | 13 |
| 2 | JP | Janata Party | 10 |
| 3 | Independents & Others | Independents & Others | 37 |
| Total | 60 | ||
The 1980 Manipur election presented a deeply pluralistic and unpredictable political scenario. The INC(I) claimed leadership without a majority, while the Janata Party and INC(U) made substantial entries. The MPP’s decline and the strong showing of independents highlighted shifting allegiances and heightened local influences.
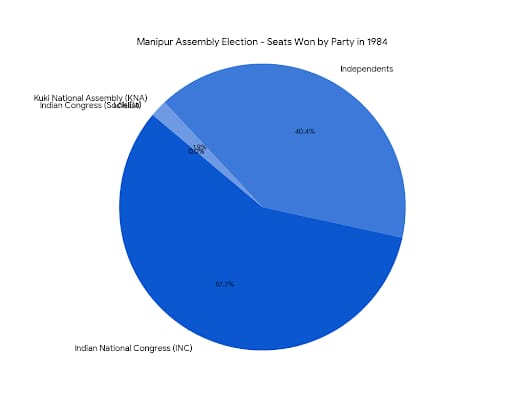
| 1984 Manipur Legislative Assembly Election Results | |||
|---|---|---|---|
| Sr. No. | Short Name | Full Name | Seats |
| 1 | INC | Indian National Congress | 30 |
| 2 | Independents | Independents | 21 |
| 3 | Other | Other | 9 |
| Total | 60 | ||
The 1984 Manipur election was a critical turning point—a period marked by a resurgence of the INC under Keishing, the remarkable electoral strength of independent candidates, and an overall fragmentation of party influence. The results underscored the importance of local dynamics and set the stage for new patterns in Manipur’s political journey.
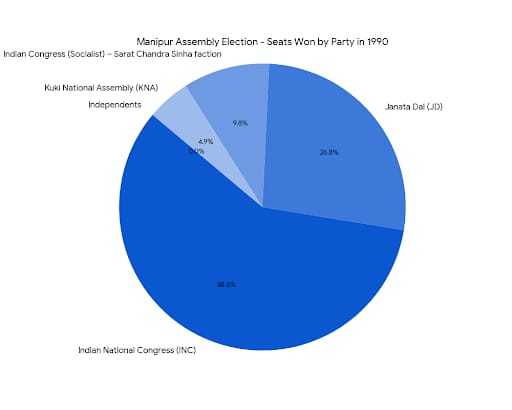
| 1990 Manipur Legislative Assembly Election Results | |||
|---|---|---|---|
| Sr. No. | Short Name | Full Name | Seats |
| 1 | INC | Indian National Congress | 24 |
| 2 | JD | Janata Dal | 11 |
| 3 | MPP | Manipur Peoples Party | 9 |
| 4 | Independents & Others | Independents & Others | 10 |
| Total | 54 | ||
The 1990 election in Manipur marked a highly dynamic and fractured political landscape. Though the INC led in both vote share and seats, the MPP outmaneuvered others by forming the government. The rise of new parties like Janata Dal and the INC (Socialist) faction, coupled with the decline of independent candidates, highlighted the evolving nature of state politics in this period.
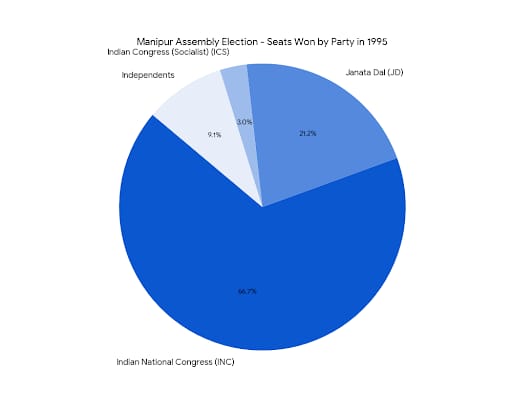
| 1995 Manipur Legislative Assembly Election Results | |||
|---|---|---|---|
| Sr. No. | Short Name | Full Name | Seats |
| 1 | INC | Indian National Congress | 22 |
| 2 | MPP | Manipur Peoples Party | 18 |
| 3 | JD | Janata Dal | 7 |
| 4 | Independents & Others | Independents & Others | 13 |
| Total | 60 | ||
The 1995 Manipur Assembly election marked a transformative moment in the state’s political trajectory. The INC remained in power, but the MPP's resurgence, emergence of several new political players, and exceptional voter turnout highlighted a dynamic and evolving democratic scenario.
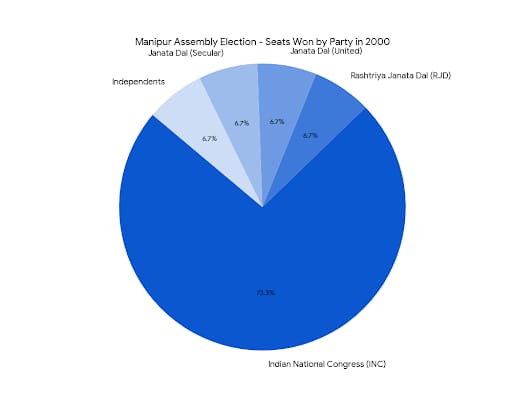
| 2000 Manipur Legislative Assembly Election Results | |||
|---|---|---|---|
| Sr. No. | Short Name | Full Name | Seats |
| 1 | MSCP | Manipur State Congress Party | 23 |
| 2 | INC | Indian National Congress | 11 |
| 3 | FPM | Federal Party of Manipur | 6 |
| 4 | Independents & Others | Indian National Congress | 20 |
| Total | 60 | ||
The 2000 Manipur Assembly election marked a striking transition—ushering in the MSCP as a formidable force, while established players like the INC and MPP saw considerable erosion. The political environment also became more diverse, with numerous new parties gaining entries and independents receding, reshaping governance dynamics in the state.
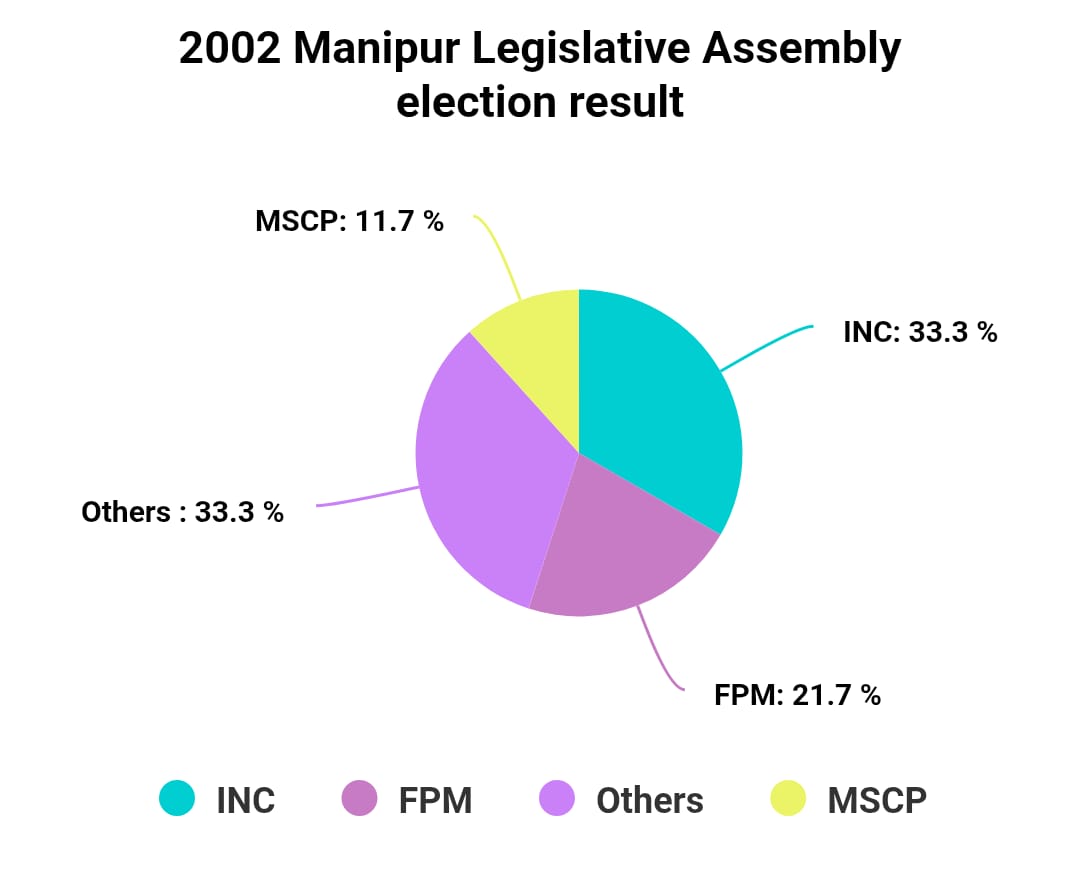
| 2002 Manipur Legislative Assembly Election Results | |||
|---|---|---|---|
| Sr. No. | Short Name | Full Name | Seats |
| 1 | INC | Indian National Congress | 20 |
| 2 | FPM | Federal Party of Manipur | 13 |
| 3 | MSCP | Manipur State Congress Party | 7 |
| 4 | Independents & Others | Independents & Others | 20 |
| Total | 60 | ||
The 2002 Manipur Assembly election marked a significant reshaping of state politics—returning the INC to leadership via a coalition, highlighting FPM as a potent regional force, and signaling a shift toward more structured party competition with new entrants and collapse of independent influence.
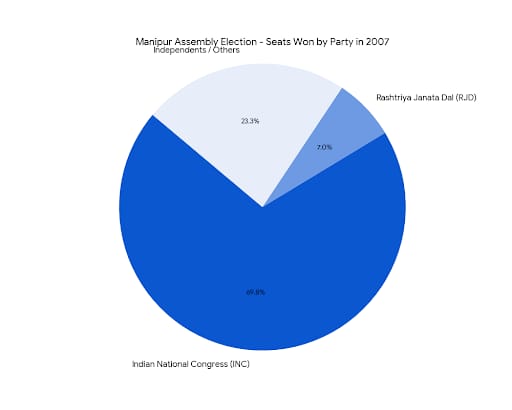
| 2007 Manipur Legislative Assembly Election Results | |||
|---|---|---|---|
| Sr. No. | Short Name | Full Name | Seats |
| 1 | INC | Indian National Congress | 30 |
| 2 | MPP | Manipur Peoples Party | 5 |
| 3 | NCP | Nationalist Congress Party | 5 |
| 4 | Independents & Others | Independents & Others | 20 |
| Total | 60 | ||
The 2007 Manipur Assembly election reaffirmed the dominance of the Indian National Congress under Okram Ibobi Singh, while also reflecting a splintered political landscape with emergent parties and strong independent representation.
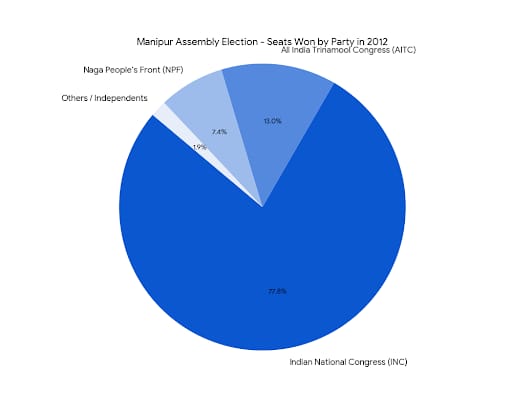
| 2012 Manipur Legislative Assembly Election Results | |||
|---|---|---|---|
| Sr. No. | Short Name | Full Name | Seats |
| 1 | INC | Indian National Congress | 42 |
| 2 | AITC | All India Trinamool Congress | 7 |
| 3 | Independents & Others | Independents & Others | 11 |
| Total | 60 | ||
The 2012 Manipur Assembly election was a turning point where Congress achieved a historic majority under Ibobi Singh, while new entrants like AITC and NPF reshaped the opposition.
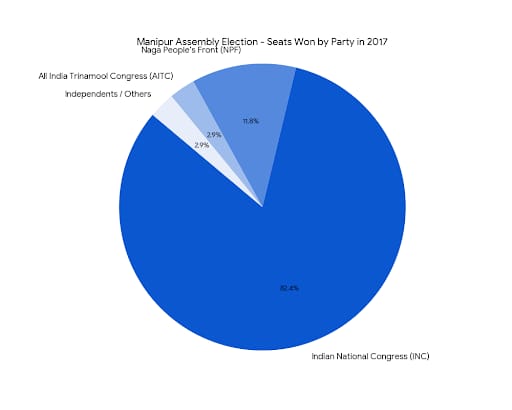
| 2017 Manipur Legislative Assembly Election Results | |||
|---|---|---|---|
| Sr. No. | Short Name | Full Name | Seats |
| 1 | INC | Indian National Congress | 28 |
| 2 | BJP | Bharatiya Janata Party | 21 |
| 3 | NPF | Naga People’s Front | 4 |
| 4 | Independents & Others | Independents & Others | 7 |
| Total | 60 | ||
The 2017 Manipur Assembly election ended 15 years of INC rule and marked the BJP’s breakthrough in the Northeast. Through smart alliances, BJP turned a hung assembly into its first-ever government in Manipur under N. Biren Singh.
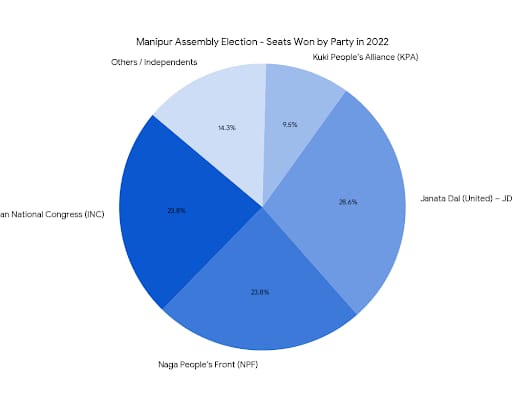
| 2022 Manipur Legislative Assembly Election Results | |||
|---|---|---|---|
| Sr. No. | Short Name | Full Name | Seats |
| 1 | BJP | Bharatiya Janata Party | 32 |
| 2 | INC | Indian National Congress | 5 |
| 3 | NPP | Naga People’s Front | 7 |
| 4 | Independents & Others | Independents & Others | 16 |
| Total | 60 | ||
The 2022 Manipur Assembly election marked a historic moment as the BJP secured a clear majority on its own, cementing its dominance in the state. Meanwhile, the Congress virtually collapsed, while regional parties like NPP, NPF, JD(U), and KPA ensured a multi-party presence in the assembly.
Disclaimer: Electioncare.in is an election management company. This is not affiliated in any way with the official website of Government of India regarding Indian Elections. The sole purpose of this website is to provide information to you by analyzing election equation and election results. All the results shown here are based on the official website of Election Commission of India (https://eci.gov.in/). Every effort has been made by us to make the state election results accessible for your use. The human team has worked on the website to display these results. We are taking utmost care, but still we cannot guarantee 100% accuracy of the information. If you find any information wrong, then you can tell our team. My team will work on it. You are required to agree to all the terms and conditions before using this website.